

I am fundamentally bullish on both gold and oil with a long-term perspective from current levels. Between the two going into the first half of 2023, gold likely has the advantage on its side.
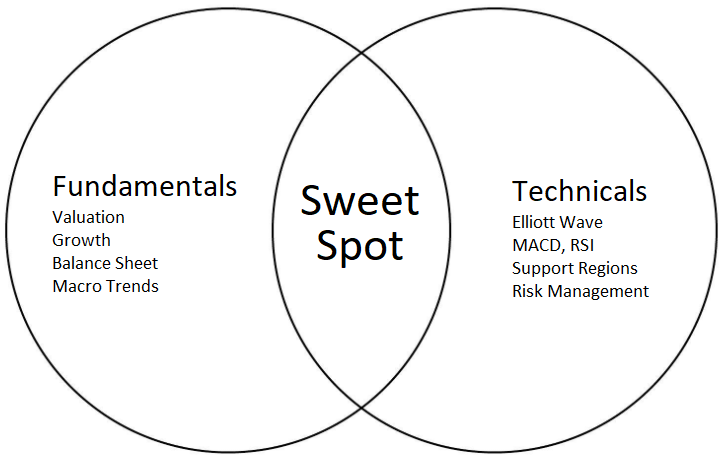
Several times per month for Stock Waves, I publish short-form piece called “Where Fundamentals Meets Technicals” that looks for intersections where the fundamentals and the technicals align, and occasionally I make one of them public. These pieces complement some of my deeper and longer-form work on the fundamentals, and thus can be used more tactically.
This issue focuses on gold and oil markets, and their respective equities.
The Economy Continues To Decelerate
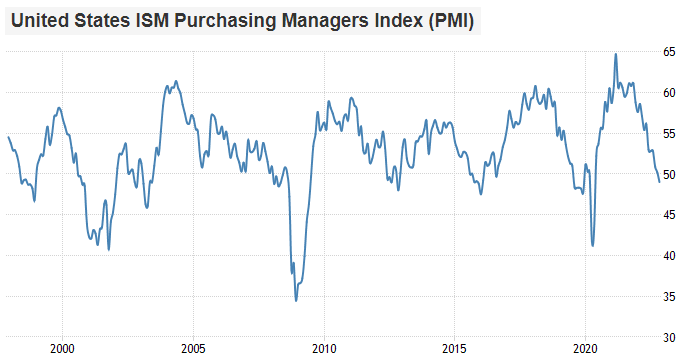
Throughout the second half of 2021 and all of 2022, the US economic growth rate has been decelerating from a high level. This means that it still has generally positive growth, but the growth is slowing towards a potential contraction.
This is perhaps best captured with the ISM manufacturing purchasing manager’s index, which tends to ebb and flow through roughly three-year cycles.
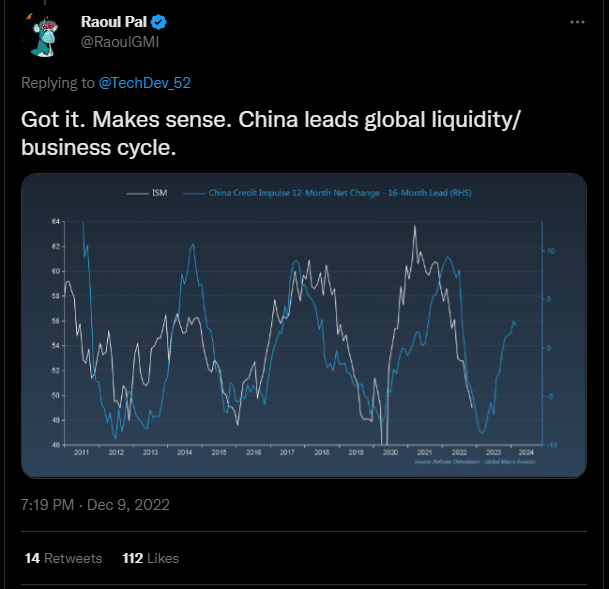
As @RaoulGMI has publicly shown, the China credit impulse tends to lead the US ISM PMI cycle:
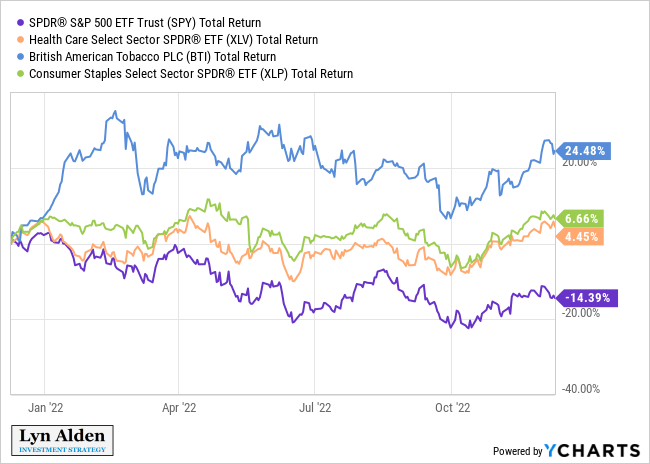
Normally during a decelerating economy, defensive assets hold up better than aggressive assets. This was mostly true for 2022, with healthcare, tobacco, consumer staples, and other defensive equity sectors like that holding up better than more cyclical or expensive sectors. However, due to a supply squeeze and high inflation, bonds did way worse than they normally do in a decelerating economy, and energy equities did way better than they normally do in a decelerating economy.
Most indicators suggest that the economy will worsen into 2023, and probably have a bottom somewhere in that year. The timeframe can of course be refined as more data come in. A lot can happen in a year, including geopolitical events and policymaker decisions.
Gold Vs. Oil Equities
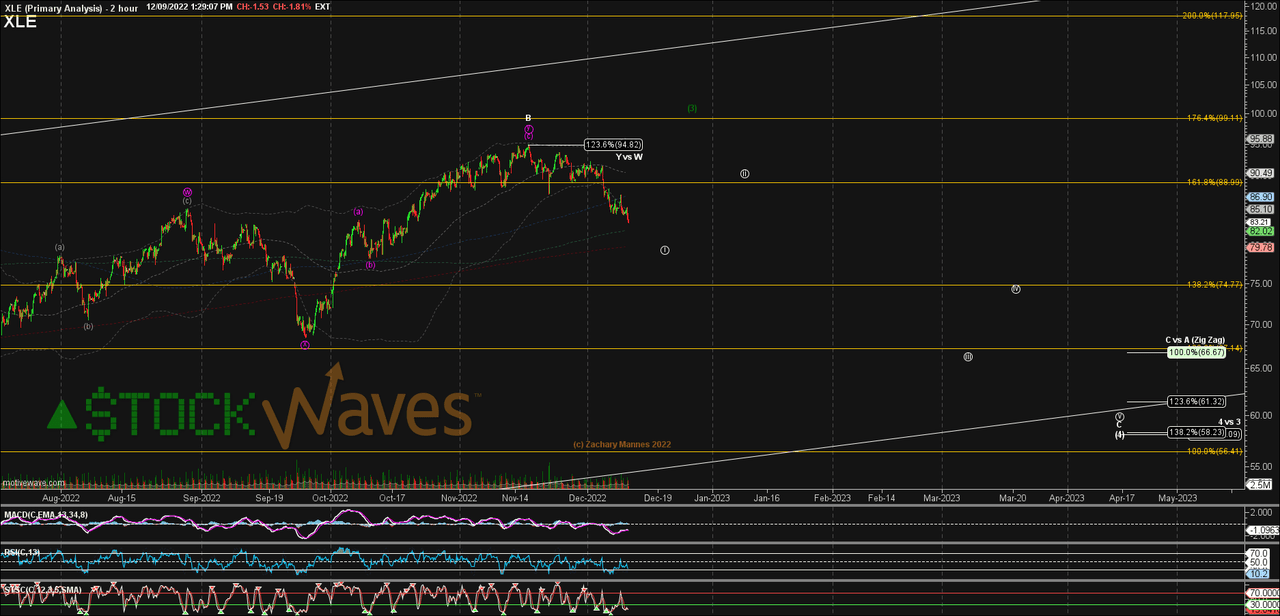
Zac from Stock Waves has been rather technically bearish on energy equities (XLE) in recent months, pointing towards a lower low in 2023.
However, he sees this likely continuing with a bullish trend in late 2023 or into 2024. Here’s his Exxon Mobil (XOM) chart, for example:
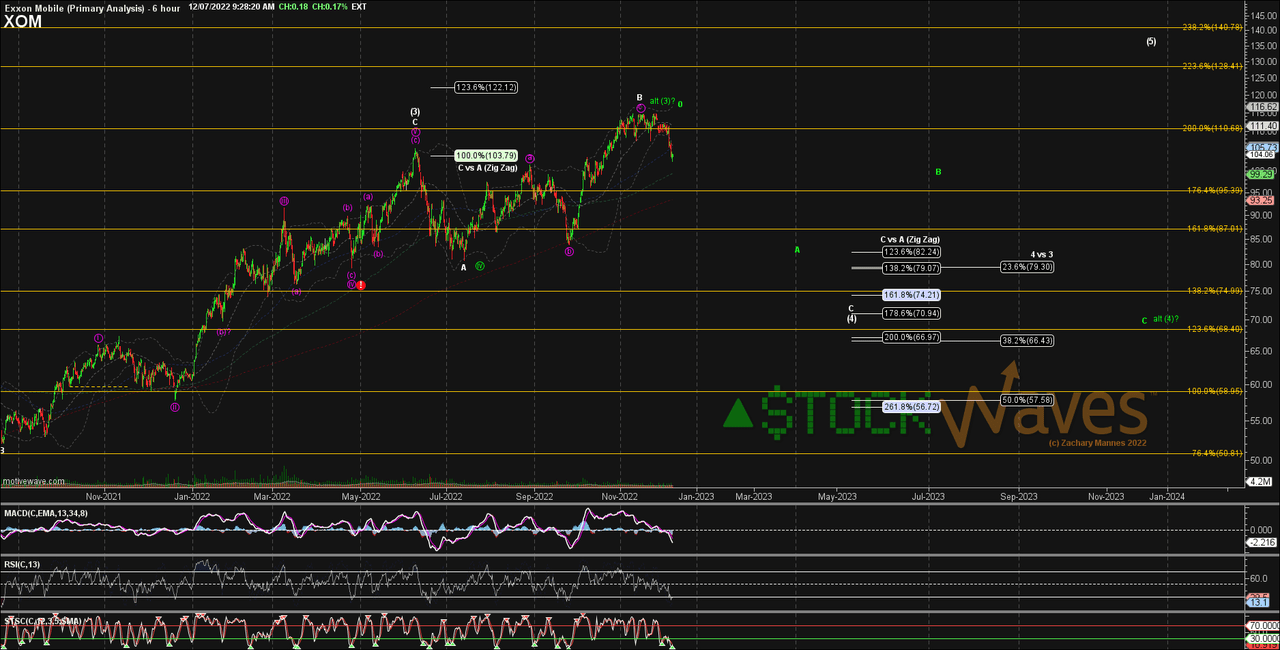
Based on normal PMI cycles, his estimated timeframe is right in line with where a potential PMI bottom is likely to be, sometime in the late spring of 2023. An outright full-on recession, however, could delay the PMI bottom until late 2023 or into 2024.
While I’m perhaps not as bearish as him as I look at the tightness of the energy supply side, I can certainly see the case for softness in energy equities for the next 6-12 months for cyclical reasons. I view the US and the rest of the world as being in a disinflationary cycle, as part of a larger structural inflationary period that will stretch through much of the 2020s decade.
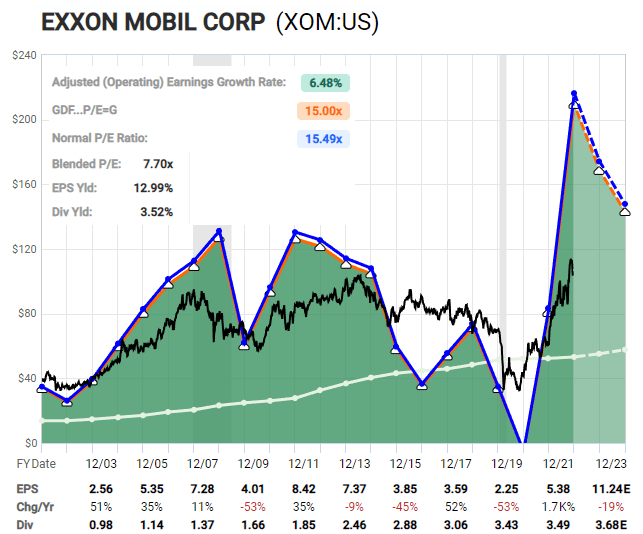
For example, Exxon Mobil is cheap, but there aren’t necessarily a lot of catalysts to help it reach a new leg higher, until there is a renewed economic growth period (i.e. a renewed uptick in PMI). The energy supply side is tight, but if demand is weakening too, then that can take time to work itself out.
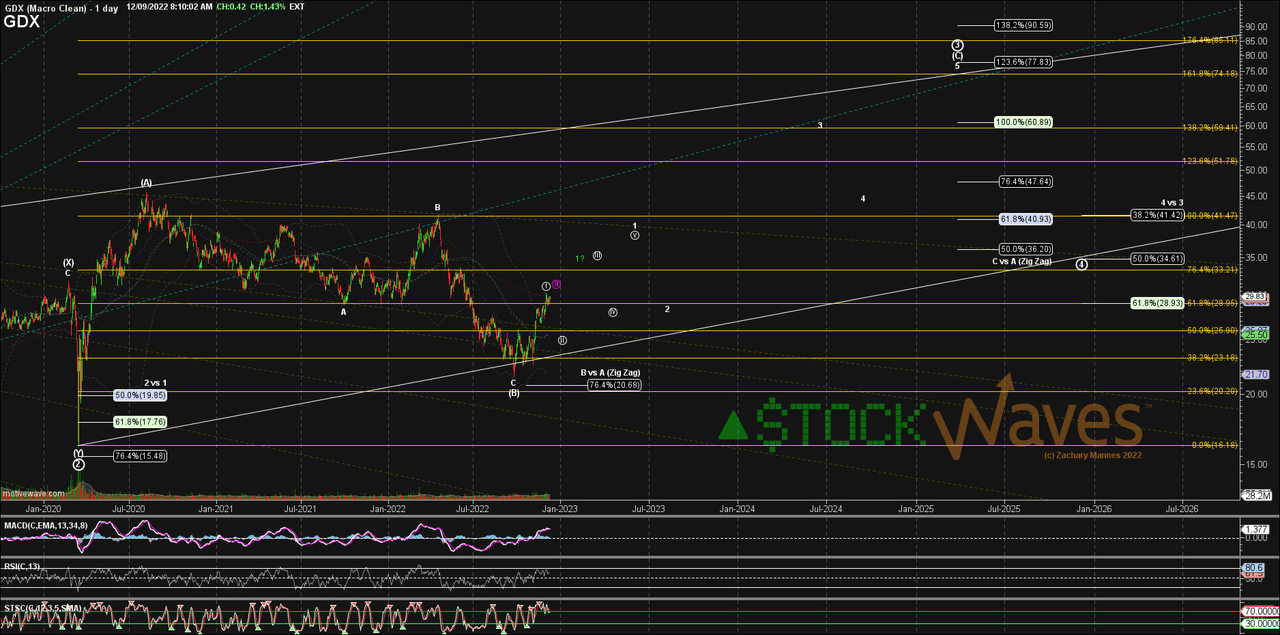
On the other hand, while he sees the prospect for a temporary correction after recent gains, Zac’s base case from a technical perspective is that the bottom in gold equities (GDX) is already in.
When I zoom out and look at the underlying commodities (gold and oil), gold indeed has significant momentum on its side. This following monthly chart shows the ratio of gold to oil over the past three decades, where a higher level means that gold is outperforming, and a lower level means that oil is outperforming.
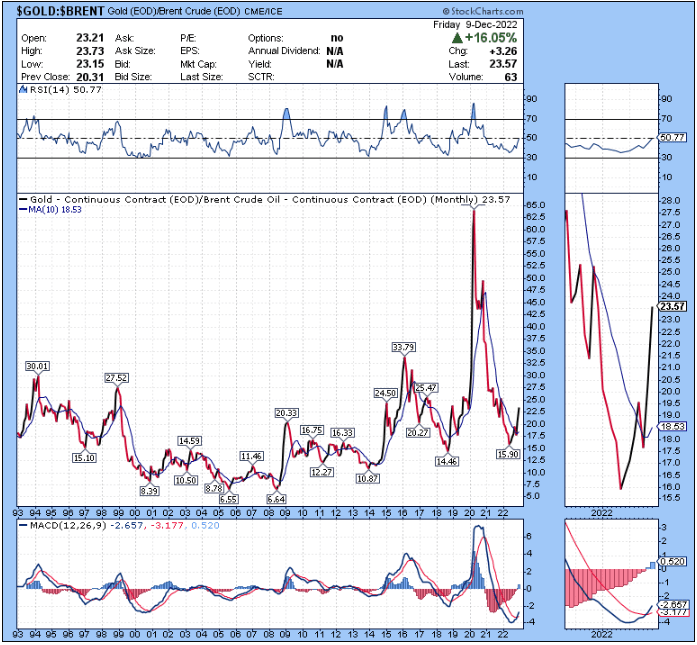
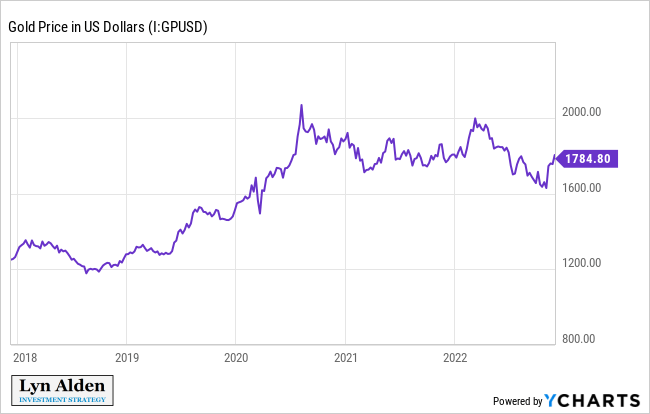
This gold-to-oil ratio has the first monthly MACD bullish crossover on its side since late 2018. When it did this back in 2018, gold subsequently went from around $1,200 to over $2,000 before eventually consolidating for the next two years.
While I don’t trade around my positions too much, my base case is to see the metals complex (gold, silver, and platinum) do pretty well in 2023. The momentum is now on their side, and the slowing US economy generally benefits them relative to other assets.
What oil does in 2023 will vary depending on multiple factors (e.g. whether or not there is an outright US recession, along with the pace and thoroughness of Chinese economic re-opening), but by late 2023 or perhaps into 2024, alongside the next rise in cyclical growth, I expect another significant oil rally as a base case.
Source: Seeking Alpha